Contents
IPS Assessment Package for the Seventh
Edition
IPS Seventh Edition
A Computer Program that Generates Histograms-and Much
More
Video Cassette ("Loops")
The Assessment Package for the Seventh Edition
of IPS
As the changes in the Assessment Package between the Sixth and Seventh
Editions of IPS were limited to one question in Chapter 6 and one
question in Chapter 9 in each of the A and C Series, SCI has not published
a Seventh Edition of the Assessment Package until now. Instead, schools
ordering the Assessment Package for use with the Seventh Edition received
the Sixth Edition plus a free package of replacement pages for those
questions and answers.
Now that the supply of the Assessment Package for the Sixth Edition
has been exhausted, we incorporated the changes in the printing and
published it as the Seventh Edition. Schools in need of additional
copies of the Assessment Package for the Sixth Edition will now receive
the Seventh Edition plus the original pages of the Sixth Edition where
the changes occurred. The price for the calendar year 2002 is $40.00.
top

SCI is pleased to celebrate the end of the twentieth century with
the publication of the Seventh Edition of IPS. The Sixth
Edition remains in print.
Compared to the changes made in the Sixth Edition, the changes
in the Seventh Edition are minor, but still significant. Just browsing
through the Textbook will demonstrate a great improvement in the
clarity of the photographs, especially those of equipment being
used in experiments. A number of older black and white photographs
have been replaced, as have several drawings and computer-generated
histograms.
Changes in content were made in Chapter 3, where a section on Boiling
Point and Air Pressure has been added, and the section on The Hydrometer
has been deleted. (Most car batteries are now sealed, making the
illustration obsolete.)
In Chapter 6 the experiment on The Decomposition of Sodium Chlorate
has been deleted. The Heating of Baking Soda in Section 1.1 gives
students an experience similar to that gained by the Decomposition
of Sodium Chlorate. An expanded introduction to Chapter 6 has further
smoothed the flow of ideas.
In Chapter 9 the experiment on The Size and Mass of an Oleic Acid
Molecule has been rewritten. The results are more convincing, as
has been shown by field testing. These changes in the Text resulted
in the addition and deletion of a few questions at the end of sections
and chapters.
top
A Computer Program that
Generates Histograms and Much More
Long-time IPS users will recall the IPS Courseware,
which asked pertinent questions, and checked measurements and calculations
related to IPS experiments. Today, users demand versatile,
multipurpose software. Therefore, rather than creating new dedicated
IPS software, we looked for a quality graphing program that
incorporates a routine for constructing histograms the way IPS
students learn to construct them. The result is KaleidaGraph
3.09, Student Edition, published by Synergy Software in Reading,
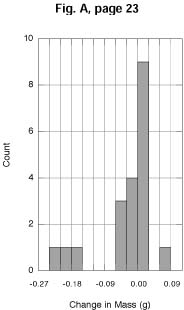
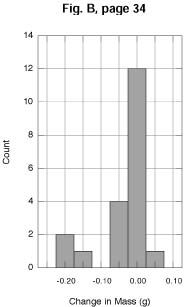
PA. The improvement in the quality of the output can be seen by
comparing Figures A and B with the corresponding figures on page
34 in the text. As discussed both in the Sixth and Seventh Editions
of IPS, the Student Edition of KaleidaGraph
lets the user select the bin size, the reference value, and the
location of the reference value (center or border).
KaleidaGraph is very powerful, fast, and user friendly.
It is widely used by engineers and scientists. In fact, many of
the graphs in the Seventh Edition were created with KaleidaGraph.
The Student Edition of the software will easily satisfy all
the data analysis and graphing needs of your students throughout
high school in biology, chemistry, physics, and other courses.
The Student Edition of KaleidaGraph accommodates
up to 20 columns and 512 rows in each data window—over 10,000
values in all! This is more than enough to compare the results of
15 classes. The full version of KaleidaGraph accommodates
over 8 million data points but does not include the IPS histogram
routine, and costs substantially more.
The Student Edition of KaleidaGraph is available
on a CD ROM disk that contains both Macintosh® and Windows®
versions. On each kind of computer, the disk loads a version optimized
for that individual computer (e.g., Mac Plus, Power Mac, or PCs
with operating systems Windows 3.1, Windows 95).
The Student Edition of KaleidaGraph is available
only from Science Curriculum Inc.
Order Item No. SCI-032-7645 (for Macintosh and Windows), Price:
$62.00
Please mail purchase orders to:
- Science Curriculum Inc.
- 24 Stone Road
- Belmont, MA 02478-3521
Or fax purchase orders to:
- 617-489-2282
For additional information about the software and network licenses,
please call toll free
- 1-888-501-0957.
-
-
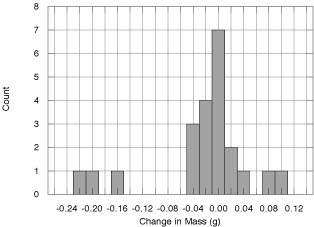
Another example of a KaleidaGraph histogram.
top
Video Cassette ("Loops")
For teachers who are not familiar with the "Loops," a few
words of explanation may be in order. When the IPS "Super-8"
film loops were first produced about 25 years ago, the four-minute
time constraint challenged the ingenuity of the IPS Group. In four
minutes all the essential parts of every demonstration had to be shown,
data had to be collected, and, in some cases, graphed to arrive at
conclusions. The equipment had to be simple to encourage teachers
and students to do the demonstrations themselves. The result was a
collection of film loops unsurpassed in clarity and conciseness even
in this age of computer-interfaced demonstrations. Far from being
a disadvantage, the absence of sound lets teachers add their own comments
or questions as they see fit.
The first three loops on the cassette are in the order in which they
appear in the Seventh Edition, although they are equally useful with
earlier editions. Those teachers who have not yet upgraded to the
Sixth Edition of IPS will find Loops 4-7 relate to Chapter
12 of the Fifth Edition. Loops 8-10 will enrich any course addressing
the kinetic theory of gases.
Contents:
- Radioactive Substances I Shows how Figure 7.2 in the
Sixth Edition is produced from Figure 7.1. It also checks the
same six substances with a Geiger counter.
- Radioactive Substances II Shows the construction and
operation of a diffusion cloud chamber (Figure 7.12).
- Motion of Electric Charges in Vacuum Takes apart a diode
and demonstrates under what conditions a current will flow through
the diode (Figures 12.9?12.13).
- Molecular Motion and Diffusion A most convincing demonstration
of how differently a drop of bromine evaporates in the presence
of air and in a vacuum.
- A Sphere-Gas Machine Shows qualitatively the relation
between volume and pressure, and between volume and temperature
for a "gas" made of small steel spheres.
- How Does the Thermal Expansion of Gases Compare? The
thermal expansion of equal volumes of three gases is simultane-ously
observed over the same temperature range. The readings for all
three gases are shown to lie on the same curve.
- How Does the Thermal Expansion of Liquids Compare? The
thermal expansion of equal volumes of three liquids is simultane-ously
observed over the same temperature range. The readings for the
three liquids are shown to lie on different curves.
- A Disk Gas (An Analog) Introduces the operation of a
unique "puck table" on which the floating pucks are
kept in motion by vibrating pucks on the boundary, providing a
much better analog than other puck tables to a real gas in a container.
- The Distribution of Speeds in a Mixture of Disk Gases
Measures the distribution of speeds of a mixture of pucks representing
two gases of different molecular mass at the same "temperature."
The lighter pucks are shown to have a higher average speed.
- How does the Effusion Time of Gases Compare? Compares
the effusion time of equal volumes of carbon dioxide and hydrogen
and raises the question of the relation between these times and
the molecular masses of the two gases.
top
|